Address
304 North Cardinal St.
Dorchester Center, MA 02124
Work Hours
Monday to Friday: 7AM - 7PM
Weekend: 10AM - 5PM

When you first install Growth Suite on your Shopify store, you’ll see a clean and simple dashboard. This dashboard shows you the most important information about your store visitors and campaigns. Let’s walk through each section so you can understand what you’re looking at.
Your Growth Suite dashboard has four main boxes that give you everything you need to know about your store’s performance.
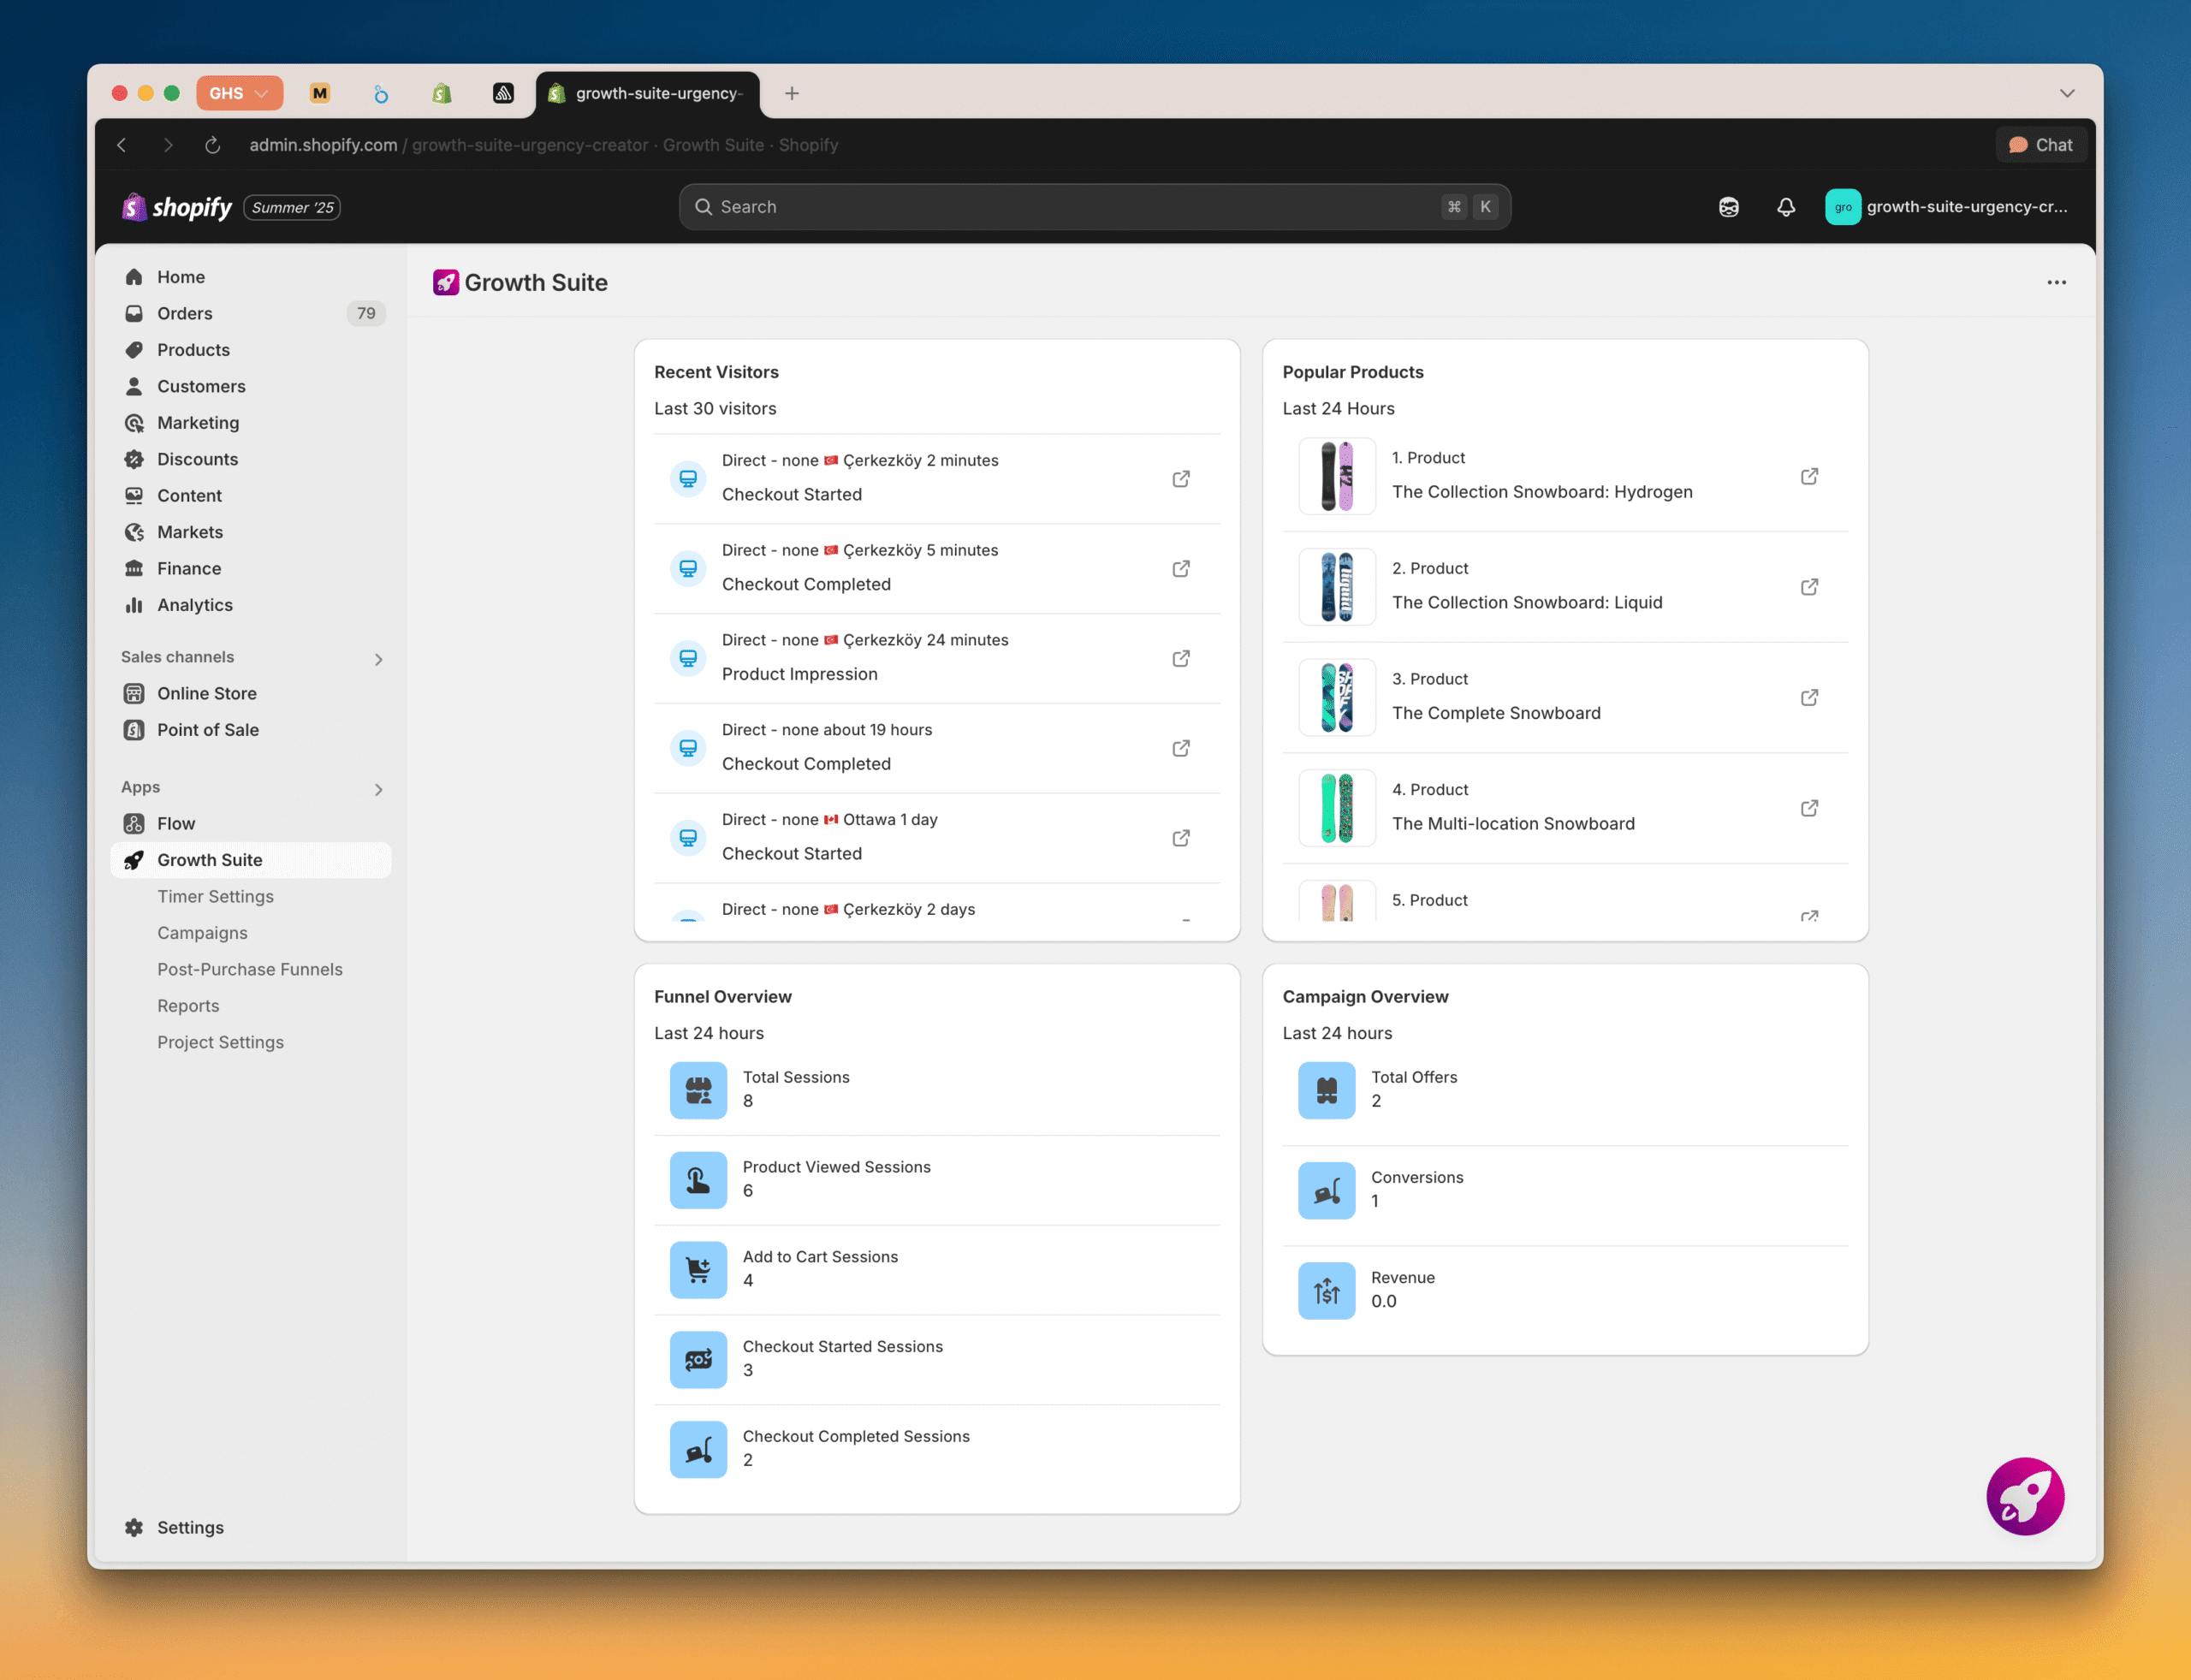
The top-left section shows your Recent Visitors. This is where you can see everyone who just visited your store.
For each visitor, you’ll see:
Growth Suite tracks every visitor through five stages:
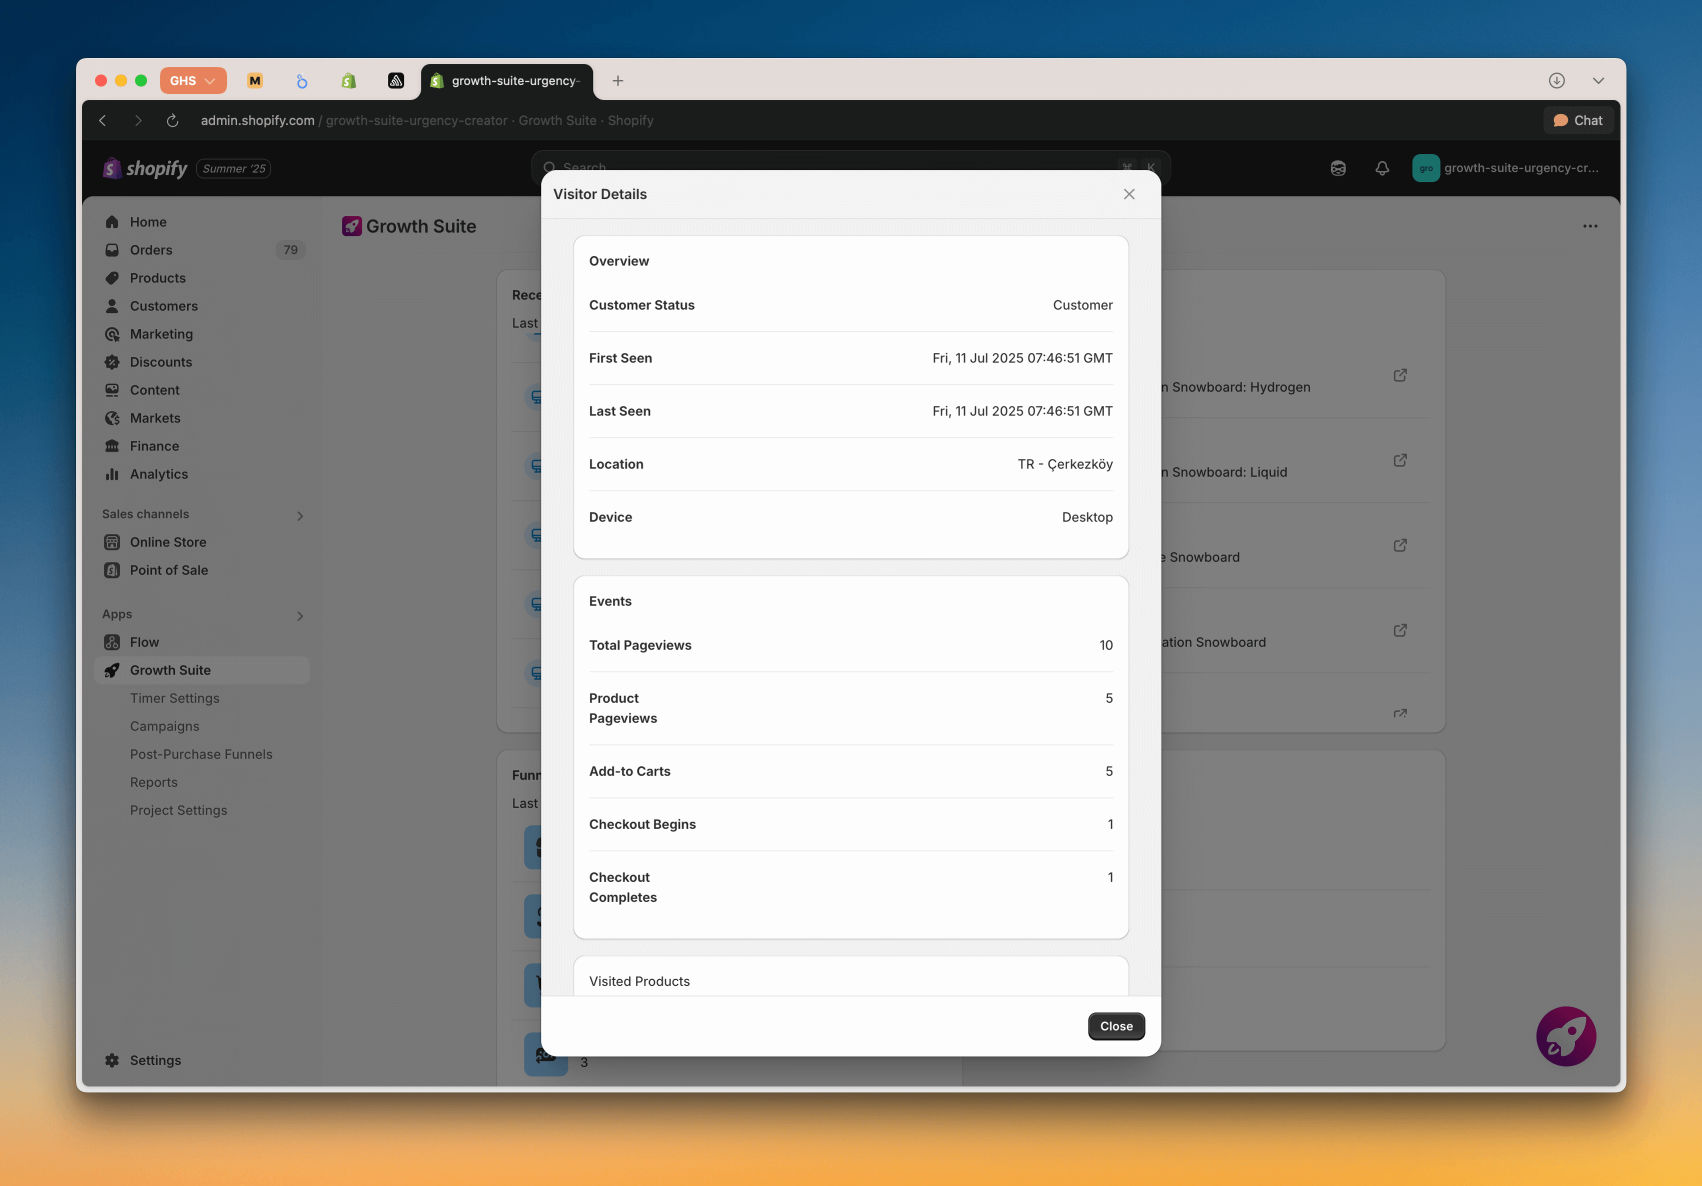
Pro tip: Click on any visitor card to see detailed information about that person. You’ll see all their sessions, what products they looked at, what they added to cart, and much more.
Next to Recent Visitors, you’ll find Most Popular Products. This shows which products were added to cart the most in the last 24 hours.
Products are listed from most popular to least popular. This helps you see what’s working well in your store right now.
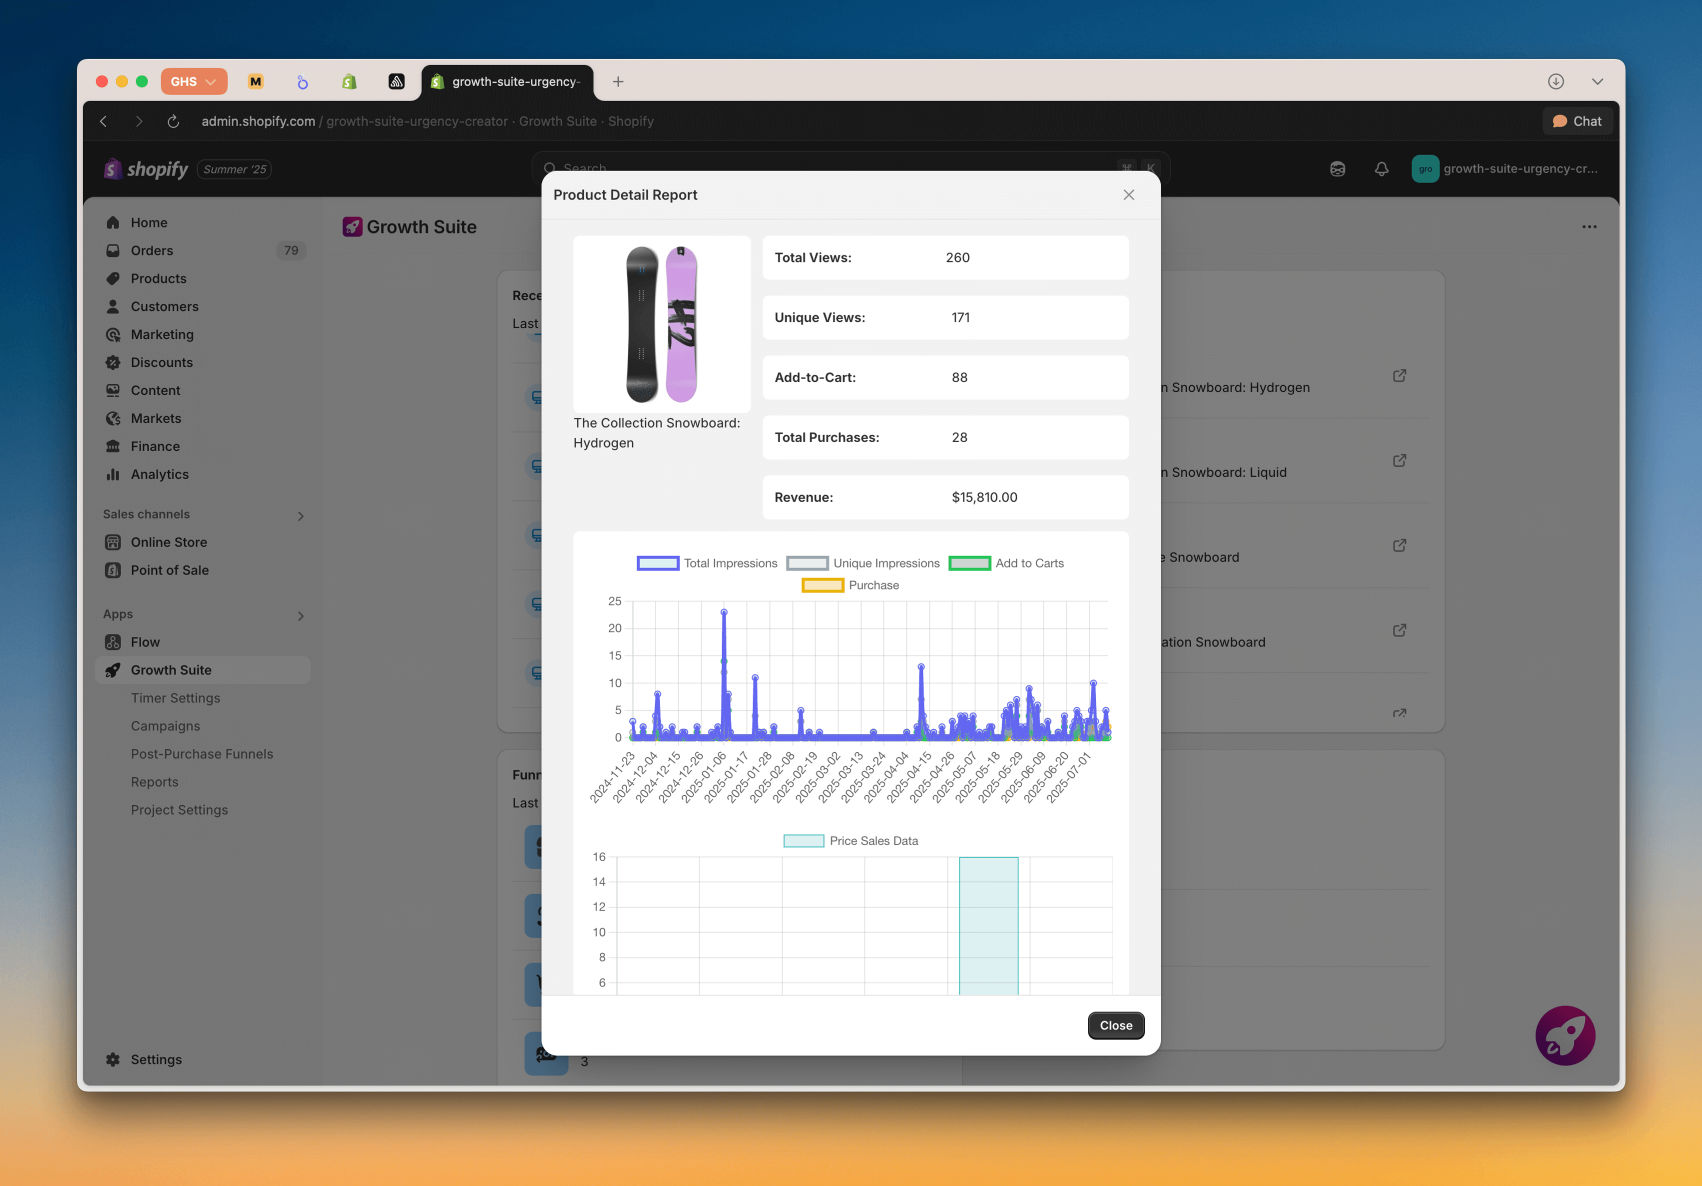
When you click on a product card, you get detailed information about that product over the last 30 days:
The third section gives you a Store Overview for the last 24 hours. These are the key numbers every store owner should know:
These numbers help you understand your conversion funnel and see where people are dropping off.
The fourth box shows a summary of all your Growth Suite campaigns. This includes:
This gives you a quick view of how well your personalized discount campaigns are working.
On the left side of your screen, you’ll see the main navigation menu. This is where you control everything in Growth Suite.
Here you can customize how your countdown timers look. You can change colors, text, and styling to match your store’s design. Everything is easy to edit without any coding.
This is where you manage all your discount campaigns. You can create new campaigns, edit existing ones, and see how they’re performing.
These are the special offers you show customers right after they buy something. You can set up different funnels and rules for when to show them.
Growth Suite gives you four detailed reports:
This is where you’ll find all the important settings for your Growth Suite installation.
Now that you understand the dashboard, here’s what you should do first:
The best part about Growth Suite is that it starts working immediately after installation. You don’t need to set up complex campaigns or spend hours configuring settings.
The app is already tracking your visitors, predicting their purchase intent, and showing personalized offers to the right people at the right time.
Your dashboard will start filling up with data as soon as visitors come to your store. Within a few hours, you’ll have real insights about your customers and how Growth Suite is helping increase your sales.
That’s it! You now understand the Growth Suite dashboard and can start using it to grow your Shopify store. Take some time to explore each section and get familiar with the data. The more you understand your visitors, the better you can serve them.